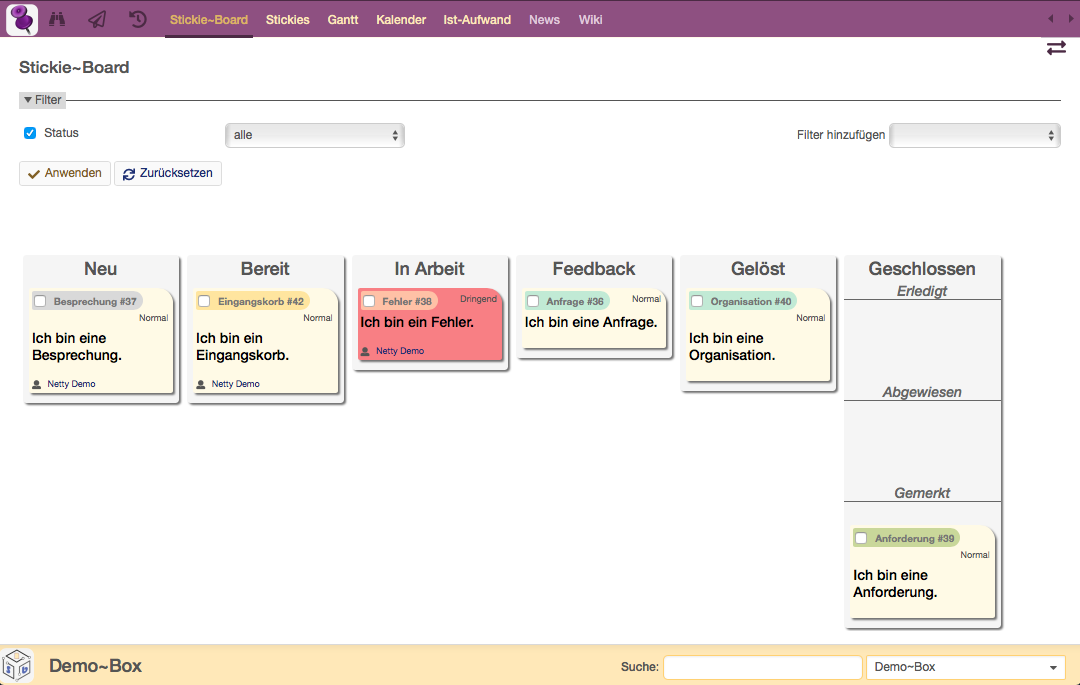
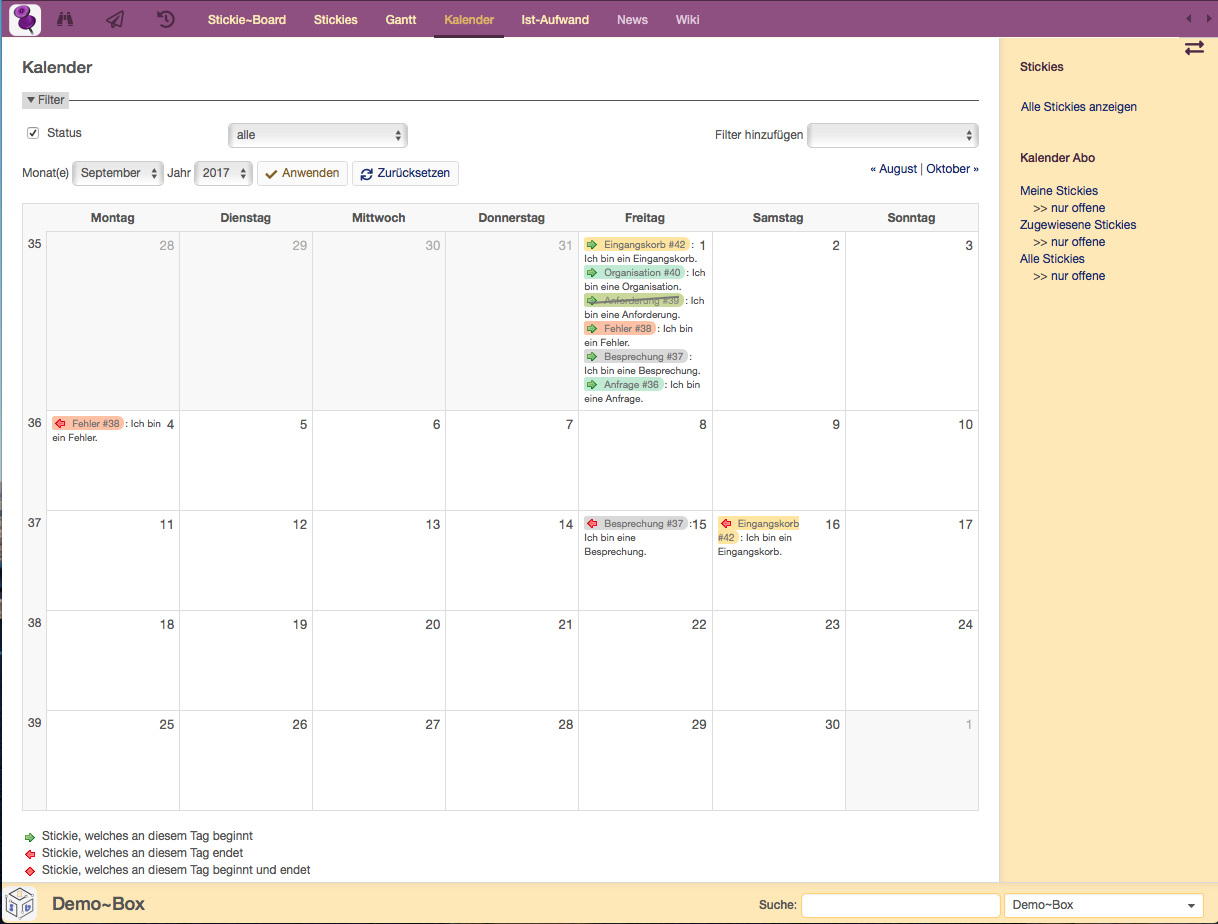
In der Kalenderdarstellung ist sofort erkennbar,
- was beispielsweise heute,
- in der aktuellen Woche,
- im diesem Monat zu tun ist.
Mittels Symbolen wird der Beginn und das Ende eines Stickies visualisiert. Werden Stickies zyklisch (agil) abgearbeitet, ist diese Information ebenfalls sichtbar.
Via Klick/Mouse over-Funktion werden weitere Informationen zu einem Stickie angezeigt.
Auch in dieser Ansicht ist die Bearbeitung eines Stickies jederzeit möglich
Listendarstellung mit allen Details und Filtern
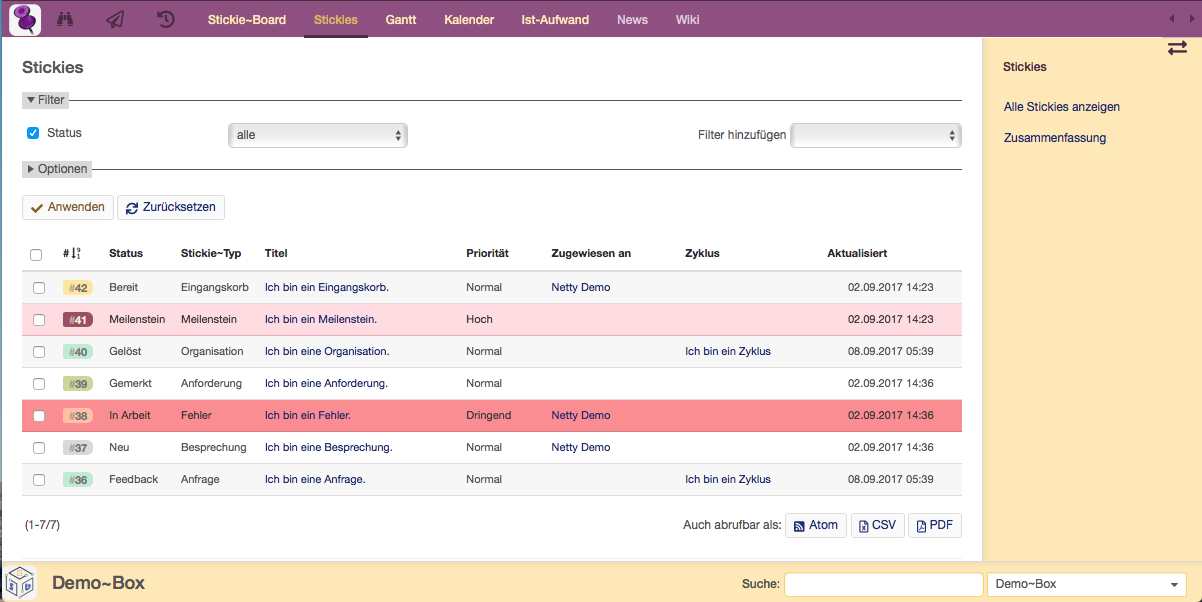
In dieser Darstellung sind alle Stickies in Listenform angeordnet.
Mittels leistungsstarken Filtern und Konfigurationsmöglichkeiten können individuelle Abfragen erstellt und gespeichert werden.
Diejenigen, die sich nicht damit beschäftigen möchten, nutzen einfach die Standardeinstellungen.
Mit Hilfe des Kontextmenüs (zB rechte Maustaste) können Stickies auch „gleichzeitig“ bearbeitet werden. Diese Funktion kann hilfreich sein, wenn Arbeiten abgeschlossen wurden und mehrere Stickies davon betroffen sind. So kann beispielsweise zeitsparend das Erledigungsdatum in einem Schritt eingetragen werden.
Das Gantt Diagramm für die Aktivitätsverfolgung
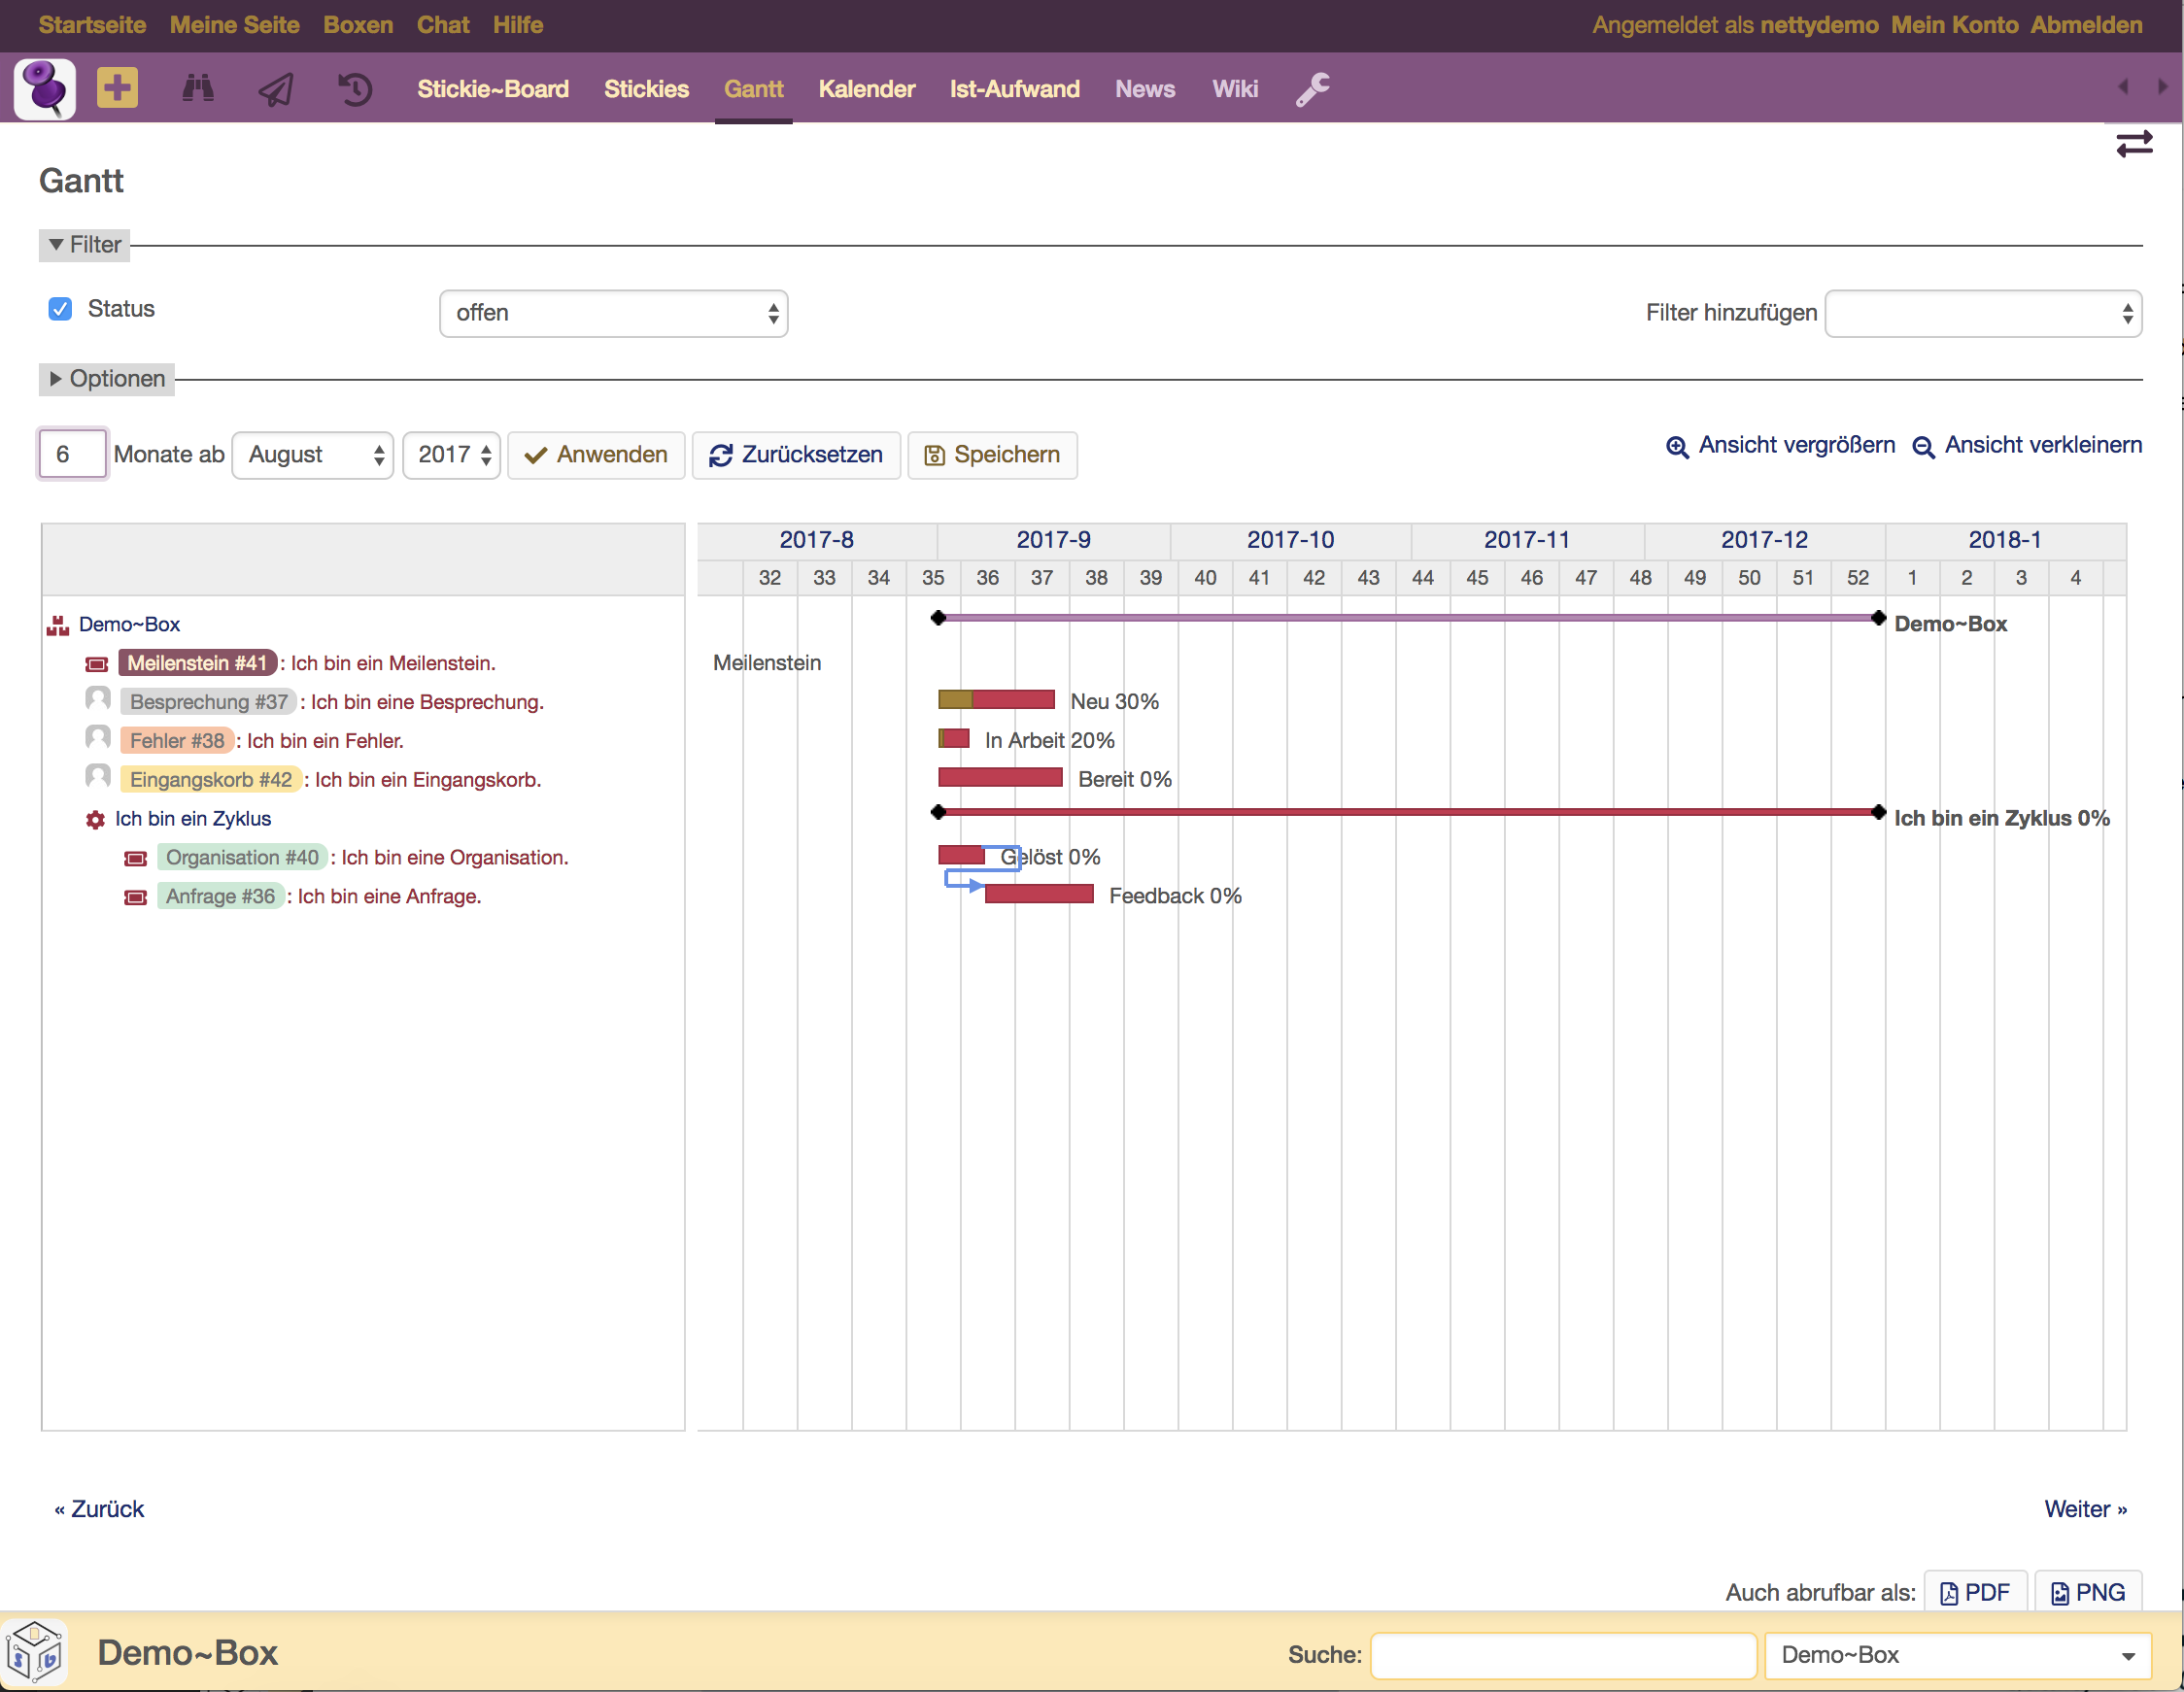
Gantt Diagramme sind eine effektive Methode, um Aktivitäten zeitbezogen darzustellen.
In Form eines Balkenplanes sind die geplanten und erledigten Aktivitäten eines Projekts dargestellt.
Die Länge der Balken zeigt die Dauer an.
Status und Fortschrittsgrad kann abgelesen werden.
Sind Meilensteine definiert, werden diese hier eingeblendet.
Sind Abhängigkeiten zwischen Stickies (Tätigkeiten) definiert, so sind diese hier visualisiert.
Auch in dieser Ansicht gibt es wieder Optionen für eine individuelle Darstellung.
Agiles Arbeiten mit Hilfe von Zyklen
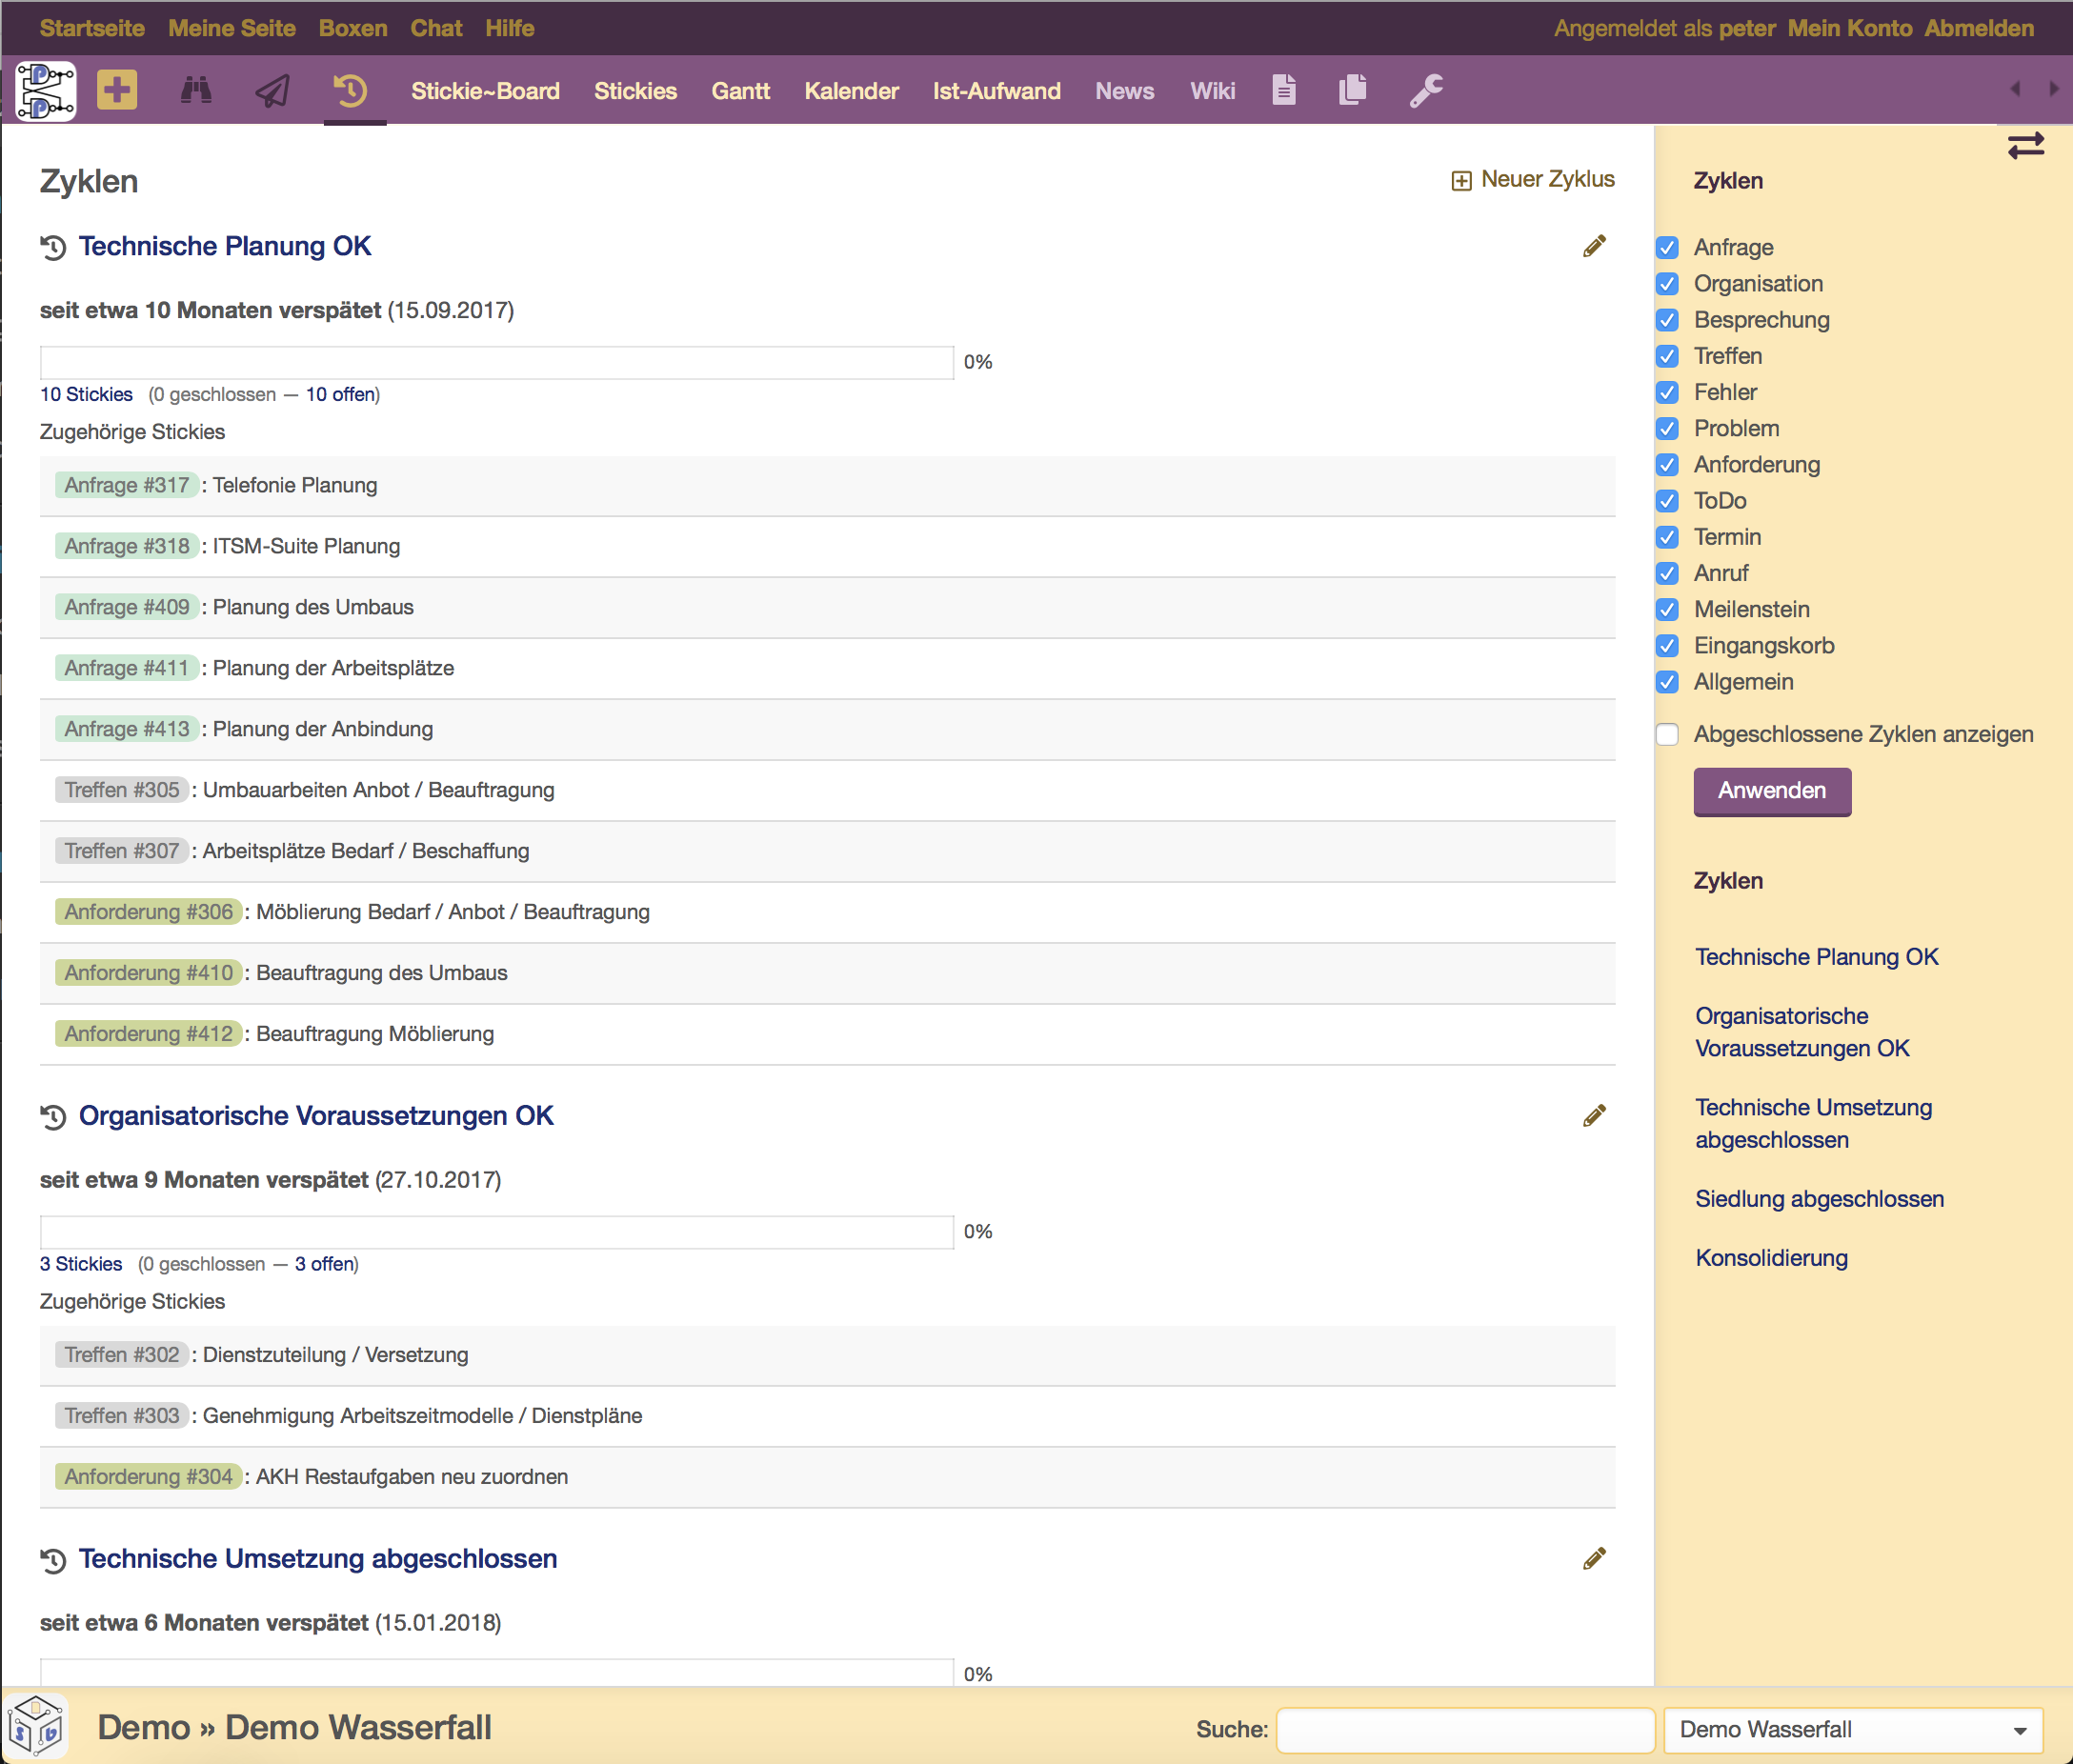
Stickies können auch einem „Run“ (= Phase, Meilenstein) zugeordnet werden. Darin werden jene Stickies zusammen gefasst,
- die in einem bestimmten Zeitraum bearbeiten und
- nach Möglichkeit auch erledigt werden sollen.
Die Bündelung der Aufgaben und ihr Erledigungsgrad wird entsprechend aufgelistet.
In agilen Arbeitsweisen ist diese Art der Aufgabenerledigung elementar. Die Methode Stickie~Flow verwendet für Zyklen den Begriff „Run“. Ein „Run“ beschreibt den Zeitraum zwischen zwei Planungsphasen. In eigenen Teamplanungsmeetings wird das Aufgabenpaket für den definierten Zeitraum zusammengestellt.
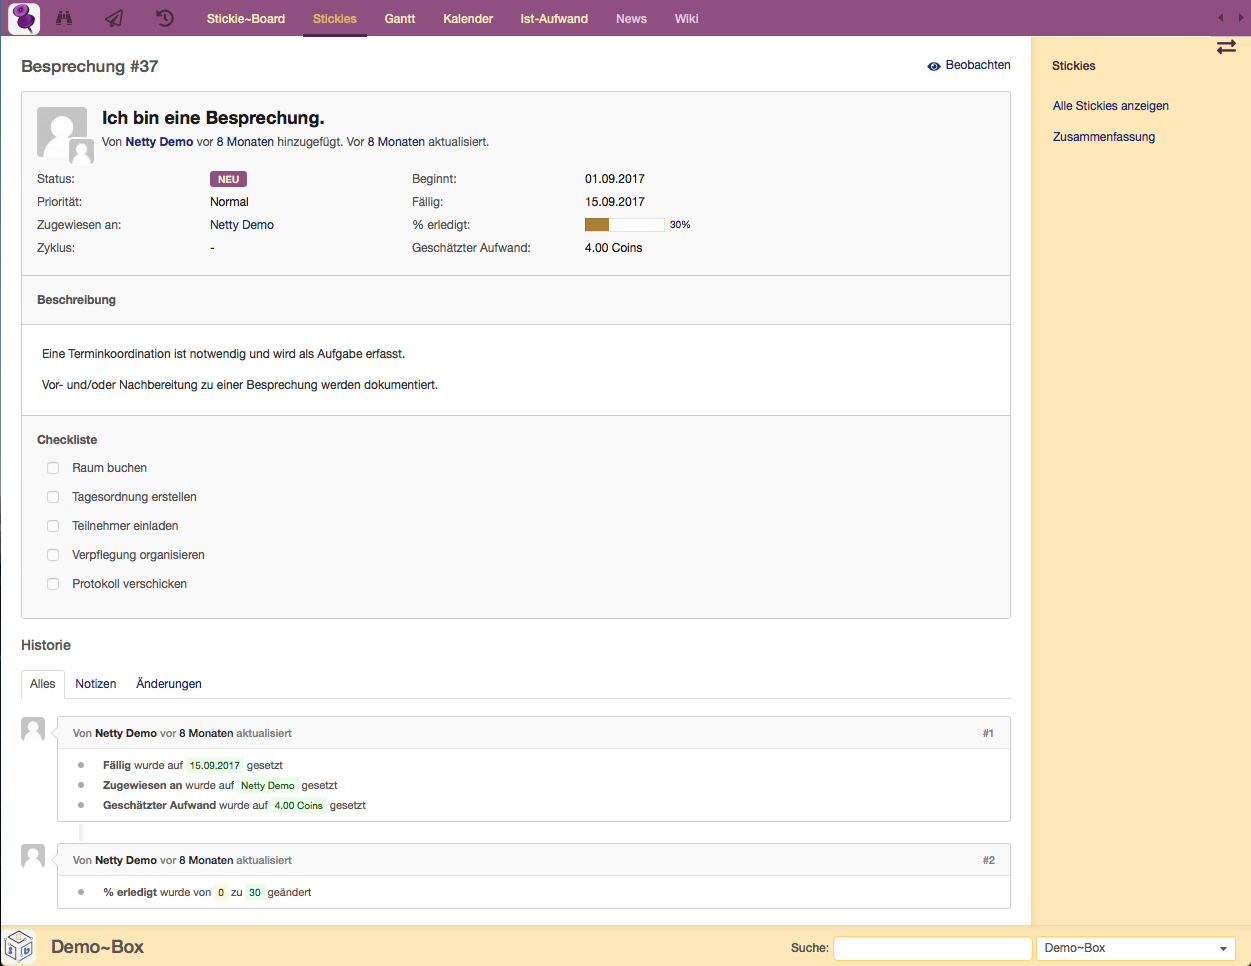 Alle benötigten Informationen werden analog zu Papiernotizen als Stickies („Zetteln“) im System angelegt.
 Stickie~Box